Track CPU and Memory Usage Per Process
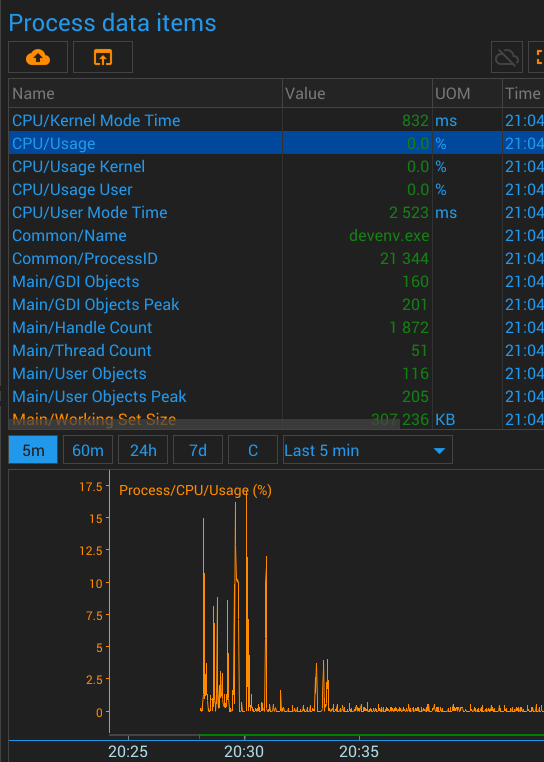
Using Gazer, you can track:
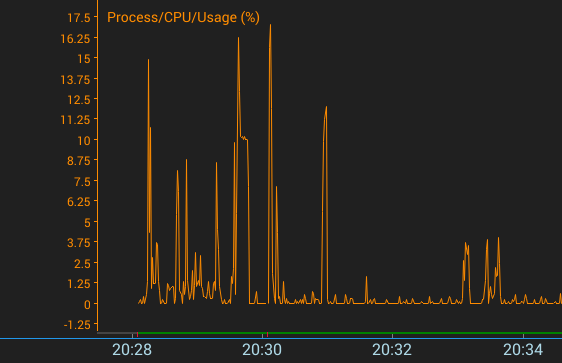
CPU usage;
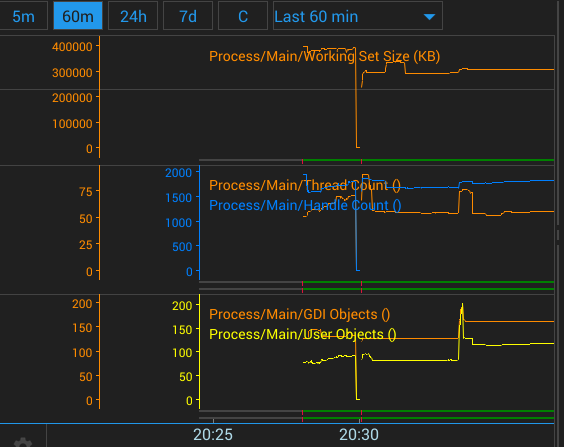
Memory usage;
Count of GDI objects;
Count of Threads;
and many others parameters ...
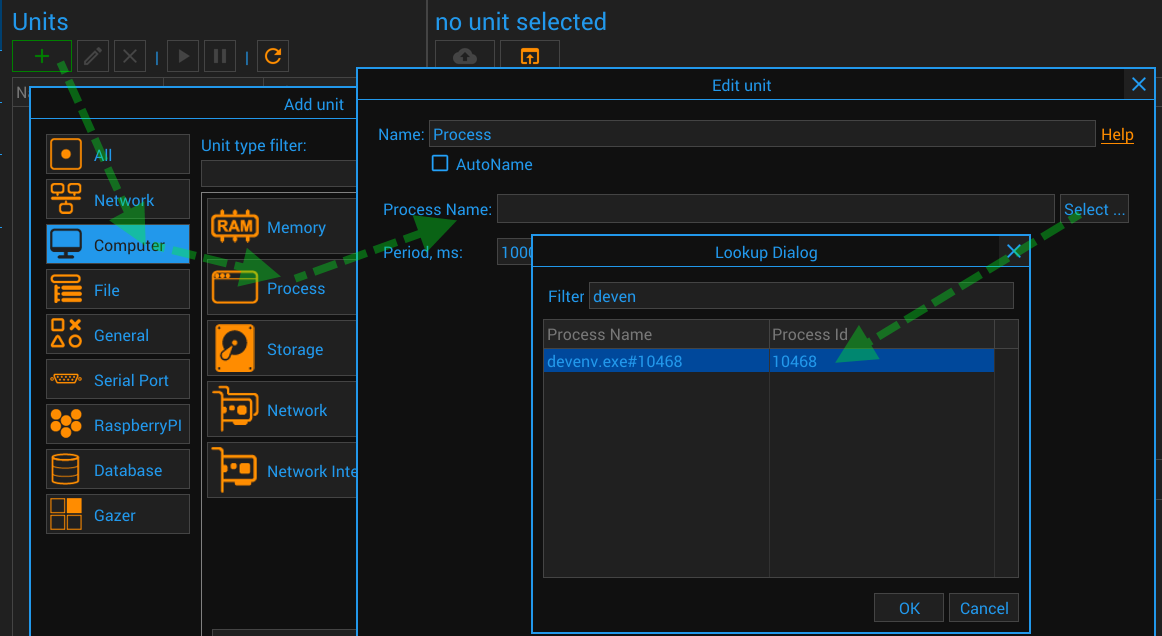
To organize monitoring of resource usage, you need to do the following:

Process filtering
Format of Process Name field: ProcessName#ProcessID
In order to monitor a process with a specific name, you need to specify its full name (e.g. "notepad.exe").
In this case, the unit looks for the first process with the specified name.
If you specify the process identifier along with the name (e.g. "notepad.exe#1154"), then the unit will also search by identifier.
Also, you can specify only the process ID ((e.g. "#1154")), in which case the unit will hard-follow the process with this ID.

Finding memory and resource leaks
Resource usage graphs will not tell you the real cause of the leaks.
But they can help you understand at what time this leak occurs and compare it with other parameters.
For example, you have some memory leak and you can see in the graph that it correlates with the increase in the number of threads in the process.
Preliminary conclusion: the required memory is allocated in dynamically created threads.
This is a very simple example, but it gives you an idea of what to do in situations like this.

Long Term Monitoring
GazerNode can also be useful for long-term software testing, collecting metrics for CPU usage or operating system resources.
List Of Metrics
| Metric | Using API | UOM |
| Common/Name | ||
| Common/ProcessID | ||
| Main/Working Set Size | GetProcessMemoryInfo | KB |
| Main/Thread Count | CreateToolhelp32Snapshot | |
| Main/Handle Count | GetProcessHandleCount | |
| Main/GDI Objects | GetGuiResources | |
| Main/GDI Objects Peak | GetGuiResources | |
| Main/User Objects | GetGuiResources | |
| Main/User Objects Peak | GetGuiResources | |
| Operations/Read Operation Count | GetProcessIoCounters | |
| Operations/Read Transfer Count | GetProcessIoCounters | |
| Operations/Write Operation Count | GetProcessIoCounters | |
| Operations/Write Transfer Count | GetProcessIoCounters | |
| Operations/Other Operation Count | GetProcessIoCounters | |
| Operations/Other Transfer Count | GetProcessIoCounters | |
| CPU/Kernel Mode Time | GetProcessTimes | ms |
| CPU/User Mode Time | GetProcessTimes | ms |
| CPU/Usage | GetProcessTimes | % |
| CPU/Usage Kernel | GetProcessTimes | % |
| CPU/Usage User | GetProcessTimes | % |
| Memory/Page Faults | GetProcessMemoryInfo | |
| Memory/Peak Working SetSize | GetProcessMemoryInfo | KB |
| Memory/Private Usage | GetProcessMemoryInfo | KB |

Using Win32 API
To obtain information about the process, GazerNode uses the following API calls:
CreateToolhelp32Snapshot
Process32First
Process32Next
OpenProcess
GetProcessMemoryInfo
GetProcessHandleCount
GetProcessIoCounters
GetGuiResources
